On 12 Oct 2026, my entire Portfolio archive was deleted when I tried to copy and paste custom HTML. I am going to have to start completely over and reupload all my material. This will take time. Due to not knowing why copy and pasting HTML into the “Custom HTML” button directly destroyed all content on the page, when this has worked every other time before, I am not going to embed any more interactive content directly into this page (aside from what is already here) until I sort out why.
Interactive Webpages
AI Verb Explorer – Verb Analysis in AI Public Discourse
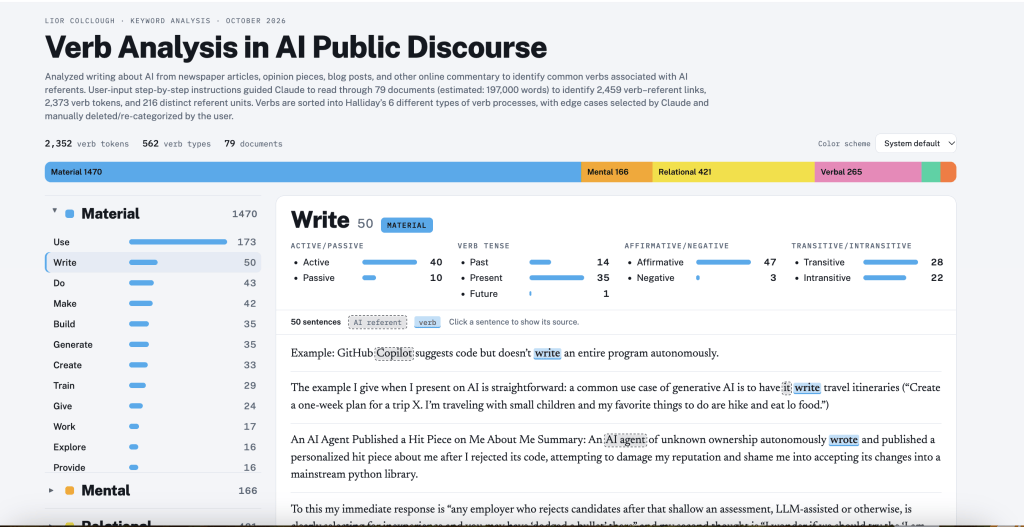
Current draft: https://claude.ai/artifact/6KCHr7RtBrxyjjxpdArgsb
Backup: https://claude.ai/artifact/V6HpwgVWZLsbgas2zVTcKL
Lior Colclough · Keyword Analysis · October 2026
Verb Analysis in AI Public Discourse
An interactive explorer of the verbs attached to AI in news articles, opinion pieces, and blog posts, sorted into Halliday’s six process types.
Open the interactive explorerDescription:
An ongoing work-in-progress using Claude Opus 5.5 to practice data-mining techniques, keyword analysis, and corpus analysis. Analyzing a user-gathered and user-input archive of PDF files of news articles, opinion pieces, blog posts, and other writing on AI in mainstream media, I experimented using Claude to identify verbs linked to AI referents (nouns, antecedent pronouns, synonyms, tropes referring to “AI”), list verbs by token and type, and then sort identified verbs into categories using M.A.K. Halliday’s six main process types in systemic functional grammar. As the corpus size is too small to use as a representative sample for discourse analysis, the primary purpose of the experiment was to build interactive HTML webpages using Claude that displayed extracted data. Edge cases were identified by Claude and then manually removed or recategorized by the user. Caveat: more user oversight is required to check each categorization decision case-by-case before verification.
Methods:
Claude was used to extract, sort, and publish data in accordance with specific user instructions. I did not use Claude or any other AI model to brainstorm, plan, or develop any steps. The Claude-produced documents of data can be found here: AI-Referent List, List of Verbs Linked to AI Referents, Verb List Outlined by Feature, and Verb List Organized into Halliday’s 6 Process Types. No generative AI text was produced in the creation of this webpage with the exception of the “Data and Methods” section, which was copied from Claude’s self-reflexive documentation of how my commands were executed. All other writing on the webpage was written by me with the obvious exception of the cited extracts and quotes from the corpus text. Prompting the AI model step-by-step, I used visualization editing tools to convert JPG images of old bar graphs from Piktochart, recorded in this blog post, into more readable, useful graphs. Then, I prompted the AI model to produce several interactive bar graphs in HTML webpages and later incorporated them into a webpage formatted and converted by Clause Opus, using all data that I manually input and checked. Format, interface design, font, and all other aesthetic choices were selected by me and applied by Claude, except for the body text, which I wrote in Google Docs and copied and pasted as needed.
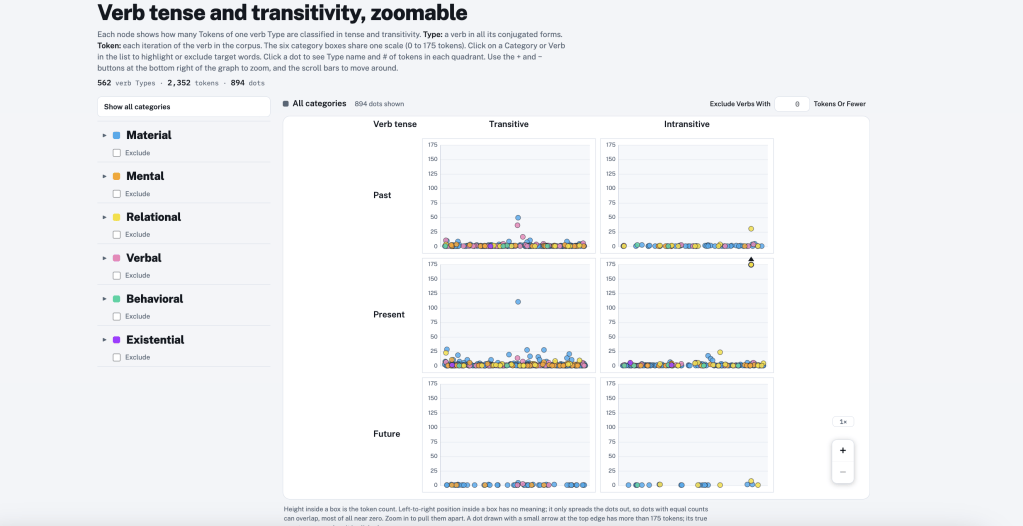
I am also designing a scatterplot graph to represent how target verbs were categorized in terms of Verb Tense and Transitivity as well to be found here: https://claude.ai/artifact/MBHnsChZ51wyz744gcBnJi
Bots Through The Times: Flash Fellowship Project 2017-2019
Description:
Experiment with prompt chaining on Claude Opus 5.5 to create an interactive webpage based on screenshots of graphs created in Piktochart circa 2018 for a Flash Fellowship research project at the DWRL. The information, which can be accessed in full at this webpage, was manually gathered and labeled by the author and input into Overviewdocs in 2017-2018. Using Claude, I drew from the notes I made in May 2018 on data between 1990 and May 2018 to create an interactive chart with an adjustable view. Because I do not have access to the original data, this project was primarily made to practice building HTML webpages to visualize data in bar graphs.
0
0
1
0
0
1
0
2
3
5
12
8
11
6
5
3
4
13
17
12
16
16
16
22
30
11
54
94
63
pt 1
Method:
The author manually downloaded a PDF copy of every single New York Times article published between 1882 and May 2018 containing the keyword “bot,” manually uploaded each document one-by-one into Overview docs, manually input metadata fields, and personally selected targeted keywords for analysis. No AI was used in the collection of this data from 2017-2018, and while Overviewdocs was an automated tagging/data visualization platform, this project obviously could not employ AI tools created in 2022, years after Overviewdocs was discontinued. Though the author does not have access to the original files, the numbers in the data are based on notes from a May 2018 presentation for the DWRL Graduate Student open house.

