This workflow log documents the steps taken to produce webpage templates for a data visualization website using the results of the 2026 U.S. midterm election. The following log records the steps that I took to gather and structure data prior to writing the prompts required to produce two preliminary outputs: 1) the website front page template 2) the first interactive HTML visualization using the datasheet table. Using multitasking skills in real-time prompt engineering and multiple AI tools at once, including Claude, Perplexity, and Netifly, for different tasks, I walk through how I was able to create these digital artifacts from scratch within a few hours and then edit and add to the project. Last updated on 14 November 2026.
Overview
Steve Kornacki may have done more to evangelize the merits of data visualization to the public than any data scientist. As a data analyst who creates interactive graphs using AI-generated code and human-evaluated data, I found myself designing an election-centric visualization of my own while the election results came in; each numerical change on the interface of my browser on the news highlighting a U.S. state on a map graph in red, purple, or blue. While my goal website cannot update election results in real time, my goal for the site is to:
- Serve as an educational resource for aspiring data visualization designers, prompt engineers working in web development, and students interested in data visualization principles. The target audience does not necessarily need to want to make data graphs; I plan to add additional educational material on how to read complicated web data and practice data literacy.
- Archive data collected at this specific point in time for future reference
- Practice creating a website from scratch using Claude-generated code and human-structured data in an ongoing project that shall be revised.
I began to draft this workflow log shortly after creating the first two webpage artifacts for correct content attribution; however, I have decided to leave the write up as a website post for my Digital Portfolio to document my process.
The following workflow log will provide:
- Background for the project: inspirations, references, constraints
- Prompt Engineering Setup: What prompt templates and strategies did I create and modify for the project prior to beginning?
- Data Collection and Evaluation: Where “did the numbers come from?” How did I consolidate multiple datasets into a single table to serve as the basis for the project?
- Output Creation: What did the actual creation of each output look like in practice? What kinds of prompts were written and what tools were used, AI and otherwise?
- Workflow Demonstration: Screencast video footage that documents my process in real time to show how I multitask. While Claude handles complex tasks, I use my note app to write prompt chains and make content-quality edits in real time, and I use tools like Perplexity for simpler tasks.
- Content Evaluation and Prompt Engineering: How I assess next steps in editing to ensure quality output production.
- Going Forward: Future steps in project planning including references from past artifacts
Within a few hours, I was able to create two digital artifacts from scratch: 1) an interactive HTML data visualization webpage and 2) a template draft for the front page of the website that would ultimately house this graph. The goal was to use data from the 2026 U.S. Midterm Elections to create a data visualization webpage that archived and represented electoral results for Senate, Congressional, and Gubernatorial races. The following post documents each step I took to create the current artifacts.
Background:
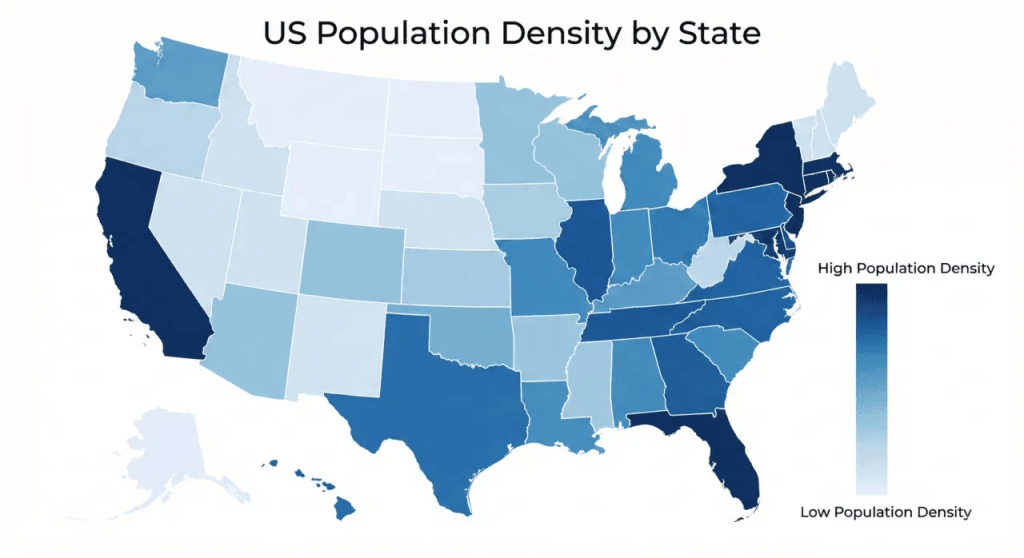
The idea for the map view page came from…every single data visualization graphic used by every news outlet. All data visualization webpages for the election essentially must have a map graph, it seems! Google search pointed towards AnyChart’s graphs of the 2020 Presidential Election as a possible resource for different designs. The image I used as a reference for the population gradient colors on the “Map” visualization I found on Google and, unfortunately, have not yet been able to source:
My inspiration for the Beeswarm visualization came from Flowingdata’s Interactive Beeswarm tutorial from almost a decade ago now and the idea to try a bubble-node Beeswarm graph in particular came from seeing the images of Minnesota-specific election results on Flowingdata. I also used my own past webpage projects on Claude as references, including Skills and instructions I had used when designing the Beeswarm/Cluster page on a website I made about Oscar data to create a new graph structure.
At the time of writing, I also intend to incorporate an interactive parliamentary graph if possible. This graph will not be difficult to produce for visualizing data; the difficulty will be visualizing all three types of elections in a single interface without clutter. I have already created a parliamentary graph static outline before for another election-data webpage that I made for Texas 2026 midterm results (I will discuss this more later).
Prompt Writing Set-Up
I begin all my long-term projects in Claude and any multi-task AI projects with a variation of a Persona-Task-Tone prompt based on this template that I wrote:
I am: a PhD-level researcher building a _______ for the purpose of _____ through a chain of steps that will ultimately produce [name output]
You are a tool that does what I say and does not talk to me like a human,
- do not use first or second person pronouns,
- Do exactly as I tell you step by step,
- Prioritize asking me for clarification if instructions are unclear over “guessing” what I mean unless explicitly told, do not offer suggestions unless asked directly to brainstorm
- Ask before altering a webpage unless I explicitly grant permission to execute a list of tasks through chain-prompting (I may or may not use that word)
- Do not offer patronizing “reassurances” or make judgment calls except in the case of feasibility (ie, “that data set may be too large for Claude to handle properly without errors”) or other factors that may impact the quality of the work
I incorporate instructions to warn me if a task will be particularly time-consuming or use extensive tokens, but otherwise I do not want input from the AI unless explicitly prompted to brainstorm within set parameters; for example, for the webpage mock-up, I prompted “give me three different color scheme options that feature navy, burgundy, and off-white for the website color theme” and selected one.
I also explicitly write into each project’s opening Persona/Task/Tone instructions that Claude should not edit a live artifact without my explicit permission; I would rather push a button to explicitly grant Claude permission to edit than deal with AI edits I did not approve, as I have in past projects. Before executing a multi-step prompt chain, I often “test” Claude by having it execute a two-step prompt on a smaller dataset before prompting it to make artifact-wide changes. I also tend to design complex visualizations as separate artifacts from the webpage architecture so that in the event that the visualization code crashes — as it sometimes does — the website template remains unchanged and I do not lose my work.
When designing graphs, I write extremely detailed, step-by-step instructions and indicate the end-goal output as a reference framework. I only tell Claude the target output I want it to build in a separate session, rather than my overall goal, to avoid confusing the AI; I can organize projects myself.
For example, here is the three-step task I used to create the graph structure for the Beeswarm/Bubble visualization. Alongside these prompts, I also inserted the CSV sheet for the current draft of Table 2 as the reference, since I had just been updating the data recorded there.
Sample Prompt:
I want to start building our first interactive visualization based on this data. I will prompt you step by step — we start with the graph design first, then the data. Output 1: Visualization – Beeswarm or bubble graph (Unsure yet) where the x axis indicates margin of win or lose on a scale of -100% to 100% with a bold line down the middle marking zero. The y-axis area is gong to have 50 sections divided by state (It is okay for the image to be large and scrollable to see all the data on it). Task: I am going to ask you to make me the prototype of that graph. I will tell you when to put data on it and how to visualize it. Reference note: I will say ultimately the nodes on this graph will each represent a single election (row on the table)
Now I describe data before you input. Explicit permission: can give design suggestions on feasibility if difficult to execute task and adhere to Instruction: Prioritize clarity of information presentation
Node: each individual Senate CANDIDATE. Dataset: (for now) Senate data only
Color of Node: Navy for Democrats, Burgundy/rich warm red for Republicans
Position of node on graph: Percentage in margin column
Size of node: Scaled for number of votesNow let us take off the Senate data for a moment. Instead, let us try this with Congressional data
In this chain of prompts, I first had Claude create the graph structure. Then I had it add the data points with each node visualized as instructed. After inserting a place to pause after the data was added to the graph, I then prompted it to apply the same task chain to another data sheet and execute both of the previous steps on its own.
Notice that I gave Claude explicit permission to provide design advice if the task was difficult to execute properly. Beeswarm graphs can be tricky to make, even interactive ones, because too many nodes in larger data sets can overlap on a chart, making the graph difficult to read.
When creating the webpage layout, I used search engines to find common proportions for website headers, margins, and sidebars relative to the main page content, then copied and pasted the exact proportion instructions.
Sample Prompt:
Task 1: Now we are going to add a sidebar. First, let’s get the proportions right. Keep a margin around entire graph of about (Standard / 1200px – 1400px): 40px – 60px. On each side. The left margin of the visualization should line up with the title. The sidebar on the right side of the screen should be proported 240px to 300px wide. It should not take up less than 15% of the viewport width and no more than 25% of the viewport width, leaving at least 75% to 85% for the main content area.
Task 2: Insert wider margins around the entire webpage on both sides so that the visualization and the sidebars seem less cramped. Let’s make margins around (1200px – 1400px): 40px to 60px. Adjust proportions of main content appropriately but keep basic layout
Data Collection and Fact-Checking
Data Collection: The primary data source was Ballotpedia, though I did use other news sources to fact-check data. In some cases, the election results had not been finalized when I began prototyping this project shortly after the November 3rd midterms. A week or so before beginning this particular webpage, I collected the data primarily by copying and pasting from Ballotpedia and other relevant sources directly into Claude and Perplexity to create multiple spreadsheets of election data. For the population gradient in the Map visualization, Census Data was suggested by Claude to estimate population closely enough to visualize using the color key. I also just copy-pasted entire lists of current senators and congressional representatives from government websites such as the Directory of Representatives as needed.
Data Reference: Before beginning to create, I uploaded a combination of previously organized Excel sheets with Election data to create the Table that would serve as the data set. The initial spreadsheet was missing information for gubernatorial elections, and the other datasheets used to compile the table had information for some election types and not others; for instance, marking the Win/Loss column in (I believe) the Senate race as not in Congress. I prompted Claude to format the Table drafts using the column labels in one of the uploaded Spreadsheets as a reference.
Adding Data into Column: In one session, I used Perplexity to format the data for congressional districts while using Claude to multitask on another project. I caught a few mistakes in Perplexity, such as a missing district in California, but later verified the data’s accuracy by running the final spreadsheet against Claude. When I had multiple spreadsheets recording Senate and Congressional data, I then used Claude to synthesize the information into a Table that would serve as the data set. Once I had the data Table formatted correctly with the right column labels, I had AI verify that the math calculations on the vote percentages and margins were correct by checking that all percentages added up. Next, I added missing data for the governor elections by copying and pasting directly from Ballotpedia for wins and margins, and used MultiState‘s page to fill in the “Seat Change” column indicating which governor seats were flipped.
Editing Data in Table: I used critical thinking to prompt Claude step-by-step to calculate Win/Loss based on the total vote count and percentage already in the sheet. I copy-pasted data directly from the official roster of current Congressional members to have Claude fill in the “Incumbency” column in Congress by comparing the candidate name column with names on the list of current (November 14, 2026) congressmen to fill in “re-elected” or “not-re-elected” for identified incumbents. I started with incumbents because matching an existing name in the Table to existing names in the roster is easier on AI than identifying absence. I then instructed AI to fill in the remaining blank slates in the “Incumbency” column by marking “First Election” in rows that had a “Win” in the Win/Loss column and “Not elected” in rows that corresponded to the “Loss.”
Output Creation
I began by creating a new Project folder in Claude. My goal is to create two separate artifacts to serve as templates for the rest of the webpage. The first two separate artifacts I made were the website layout and the first visualization. Within a few hours, I also added the mock-up for a chlorpleth or map graph.
Website Layout Design
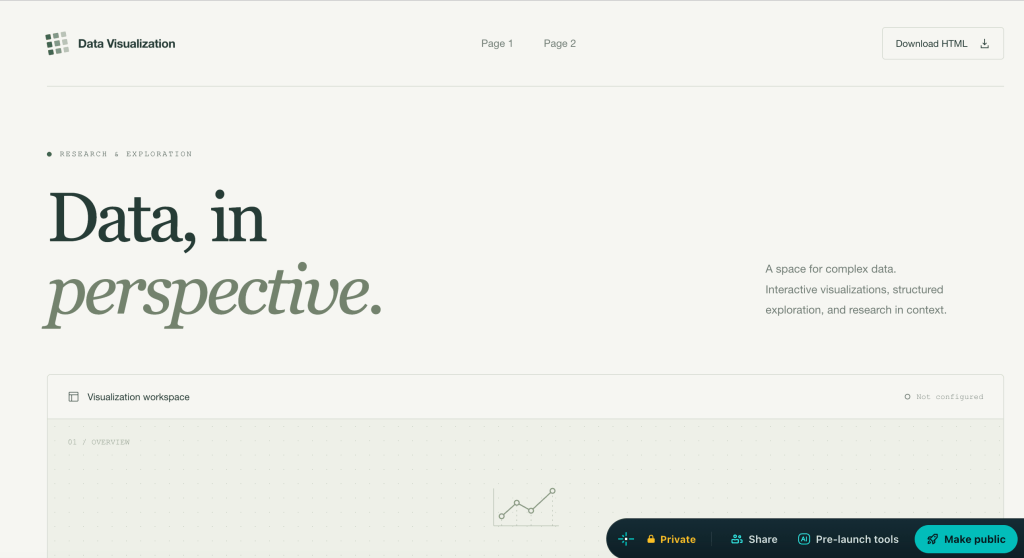
The webpage layout code was generated on Netlify. This is a screenshot of the original interface made by Netifly:
This video shows the changes I made in Claude to the Netlify-generated code when I started the project on November 14th:
The distinct visualizations for the website were made one at a time using Claude’s Project folders to keep the artifacts separate. I find working on complex visualizations as distinct artifacts using the same data set speeds up Claude’s processing time and reduces the margin of error, while also creating “backup copies” in the event of a glitch.
I edited the design layout in small sessions because the main webpage layout would depend on the website’s content format. As I worked on other artifacts, I used search engines to identify the correct proportions for different webpage elements that I edited through prompting.
Beeswarm/Scatterplot
The first visualization mock-up was intended to be a Beeswarm graph. However, the relatively small database meant that the final result was closer to a scatterplot. Because I have seen congressional districts plotted on beeswarm graphs before, I did not think carefully enough to realize that the nodes in my first visualization 1) represented only candidates who ran in 2026 and 2) the Senate race and Governor race would have comparatively low data sets compared to the 435 congressional seats up for election. For the second beeswarm visualization, I put data from all three race types across all 50 states into the default view, which suits a beeswarm chart better than a scatterplot.
This screencast video documents part of the workflow used to make the second visualization in real time while multitasking by user-testing various webpage artifacts. In the workflow documentation, I developed strategic webpage designs by testing the output, inserting benchmarks into the prompt chain to ensure Claude did not make unauthorized changes, and multitasking by writing prompts in real time while the AI processed multi-step prompt chains.
Choropleth
The choropleth (map) chart was the second interactive visualization created, but always intended to be the first visualization represented on the site.
I used two reference images to provide examples for 1) color-coding political regions on a gradient by population and 2) applying congressional district lines. I used a 2024 map as a reference and, as of writing, still plan to double-check district changes and data. To provide a list of senators and congressional representatives for seats that did not run for office in 2026, I copied and pasted directly from Wikipedia or the official roster for the House of Representatives. I also recorded myself test-checking the webpage draft (seen below) to demonstrate how to use Artifacts and Projects in Claude to move between more than one artifact-in-progress and to note out loud what changes I plan to make next.
Workflow Demo:
The videos below show screencasts of my workflow. The first video shows the very beginning of the prompt session that created the initial data visualization. The second video was recorded minutes later and shows how I multitask by writing prompts in real time in my Mac’s Notes app and updating the data sheets in Google Sheets while Claude executes my multi-step prompt chains. I incorporate “stops” into my prompt writing to evaluate Claude’s outputs at each stage of the process and ensure consistent output quality by editing in real time. The first video shows a segment of the Persona/Tone prompt template that I always copy and paste into the beginning of any AI project. In the second video, I can be seen copy-pasting data from Ballotpedia into Perplexity and prompting Perplexity to format the election data into copyable columns to re-insert into my working Google Sheets while Claude built the preliminary webpage. Perplexity requires more prompting than Claude because the browser version does not save history or skills that I store on Claude to reproduce across projects. While Claude and Perplexity completed their tasks separately, I anticipated the next step in the project and drafted new prompts in the Notes. Because I was beginning a new project, I chose to meticulously type up elements that I wanted to reuse — such as the color and size distinctions for the nodes — by hand to save as Skills that could be repeated later. NOTE: Both videos are meant to be silent, so I do not know why WordPress’s automated subtitles produce Russian text. Disable subtitles as needed. I also recommend watching at least 2x speed.
In both videos, I can be seen multitasking with other parts of the project while Claude executes instructions. I often use my Mac’s Notes app to draft prompts in real time while Claude is processing, or to write down thoughts for future edits so that I do not forget. I can also be seen using search engines to locate data sources I used earlier and find new ones as needed. AI tools do not work well to data-mine the internet without guidance, so manually copy-pasting from a webpage is far more reliable when creating detailed data visualization projects, especially when the topic is as serious as election data.
The screencast footage also demonstrates how I combined multiple AI tools and data-collection practices to refine the data Table. For instance, after the original spreadsheet was updated to include Governor election data, I re-inserted it into Claude to update the original data table used for the visualization. I also synthesized the prompt drafts I wrote in my laptop’s Notes app while Perplexity and Claude calculated my tasks, instructing Claude to update data across all three Sheets, Senate, Congress, and Governor. For example, in the Governor sheet, the win/loss margin was recorded in points, whereas the Senate and Congress sheets recorded it as a percentage. I first adjusted the Governor sheet to calculate the margin as a percentage using the points in a different column and to once again record losing margins as negative numbers (which I had in my visualization but were not indicated on the Ballotpedia page). Then, satisfied with the “test,” I used a multistep prompt chain to have Claude adjust the Congress and Senate sheets to include another column that calculates the margin in points
Content Evaluation and Prompt Engineering
I try to anticipate potential UI/UX issues with website elements as I write prompts for each step. Often, when designing a page that uses “filters” or multiple view selections, I find it best to go slowly and test functionality as I go, because it is easier to fix issues immediately than to deal with a glitch later that may be difficult to troubleshoot. When drafting a prompt chain in Notes, I often number distinct “steps” and tasks so Claude can follow them. Because I explicitly instructed Claude in this project to ask me before making any interface changes, I received notifications when each step was complete, allowing me to verify the quality of the changes before the task continued.
Example Prompt: [Task: to turn a sidebar into a scrollable menu]
I want to go back to this artifact @https://claude.ai/artifact/N99zAuiAfUdD9hWYgJNspc. 1. We are going to change the second, lower sidebar now. Instead of a list of buttons, have a single button called “States” that when you click, gives you a scroll down menu of all the states. The state names in that scroll-down menu will be clickable. Show the menu as long as the “States” button is clicked until it is explicitly unclicked or a “Clear All” button somewhere else is selected once I put that button in.
2. TASK: When a state is selected on the new menu, the visualization collapses to only show the data in the selected state. Keep all states visible in the menu setting. More than one state can be selected to be visible. When the state menu is unclicked, all states become visible again: Reference: see how in my artifact @https://claude.ai/artifact/FK3HHzBFb7jT7tC3gprGdB how the filter buttons work on the Network pages and Heatmap pages to make nonselected data “invisible” and collapse visualization when clicked. The states on the scroll down work similarly to the filter buttons.
In this prompt, notice that for some tasks (such as in “Step 2”) I described the end product output that I wanted rather than what I wanted Claude to do because I had a clear image of the end result, but not exactly how the AI would produce that result. To provide a Reference, I linked to another Artifact created in Claude, pinned to my dashboard, using films nominated at the Academy Awards as a data visualization case study (which you can read about here). Using previous Artifacts as Referents is useful because it gives Claude a basis for reusable skills, even if Skills and Data cannot be transferred directly from one Project folder to another at this point.
In addition to writing prompts in real time in Notes or Google Docs, I also record ideas for the next steps in the project. For example, I often leave small design elements, like adjusting font size or removing superfluous text, until later in the workflow, so I might make brief design notes while working on more foundational edits. I also write down the next larger steps in project planning. For example, while Claude executed my prompt chains to create the Beeswarm visualization, I was already planning which visualizations the next two pages would display and which fields cto useto highlight and filter data points.
Going Forward:
The current plan as of writing is to create one geographical “map graph” of the United States that would work similarly to the 2026 Texas Election Result prototype I also created after the midterms. The video below provides a walk-through recorded the same day that the website layout for the national 2026 Election Data Website was created.
One key distinction between the current draft of the Texas-centric page and the national page was that the Texas webpage required data from multiple election cycles in order to compare, for instance, how specific congressional districts and counties in Texas voted in the 2020 election cycle vs the 2024 election cycle. The original Beeswarm graph only compared data from the 2026 election cycle due to there simply being much more data to work with for national election results compared to a single state. However, the national election results were easier to find in a single source than the Texas county and district election results, which is documented in the above video at around 1:18 when I note that I do not have all the data for how each congressional district in Texas voted in the gubernatorial race. It is also quite difficult, if not impossible, to neatly “map” results from Congressional elections in Texas onto Texas counties due to the state’s complex gerrymandering. Travis County alone is intersected by at least five congressional districts. As such, the Texas tool is more limited than the national U.S. Election Results website.
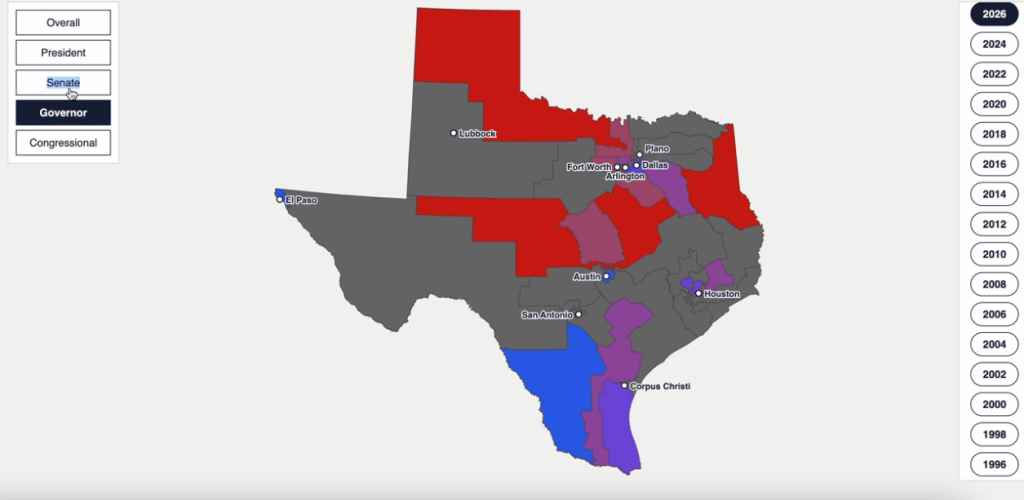
Going forward, a map view of Senate, Congressional, and Gubernatorial election results from state to state would offer clickable options similar to the Texas webpage, but I would need to calculate how to visually display Congressional results by calculating wins and losses in aggregate.
Before I create more complicated graphs, however, the data sheets need to be updated. For instance, the original draft of the Senate race view of the webpage indicated that there was no Senate race in Connecticut. There was, in fact, a Senate race — I had instructed the AI at some point to plot states with no relevant data to maintain the graph’s structure from view to view. One of the benefits of making the dataset a table prior to digital artifacts is that I can fill in the appropriate blanks on the Table and easily command the AI to adapt to new data rather than execute an entirely new task. However, working on the data sheet should not prevent me from continuing to edit the website design and maintain consistent progress.


Leave a Reply